
Key findings:
- 40% of the car toys have a negative sentiment value overall, with only 12 out of the 100 toys coming back as positive
- Bolivia’s "Road of Death" donned the most dangerous road
- China and Thailand top the lists of most hazardous countries to drive in
- Iceland and Switzerland take the awards for safest countries to drive in
- UK ranks as the eighth safest country for driving in the world
The world can be a dangerous place to drive in. For example, according to recent research, China has seen an estimated 5.5 million road deaths since 2000, and Thailand leads the world in road deaths per 100,000 people with 736 since 2000. Due to the danger of some of the roads around the world, it’s therefore surprising to see that we’re accidentally teaching kids to drive dangerously at a young age.
Here’s what Leasing Options has uncovered and an idea we’ve had in order to help teach kids how to drive carefully and safely, without sacrificing on the fun!
Leasing Options call for more toys that teach children safe driving
According to the World Health Organization (WHO), road traffic injuries are the leading cause of death for children and young adults aged 5-29 years. As a result, we've created a brand new example of a toy that would help to promote the benefits of safe driving.
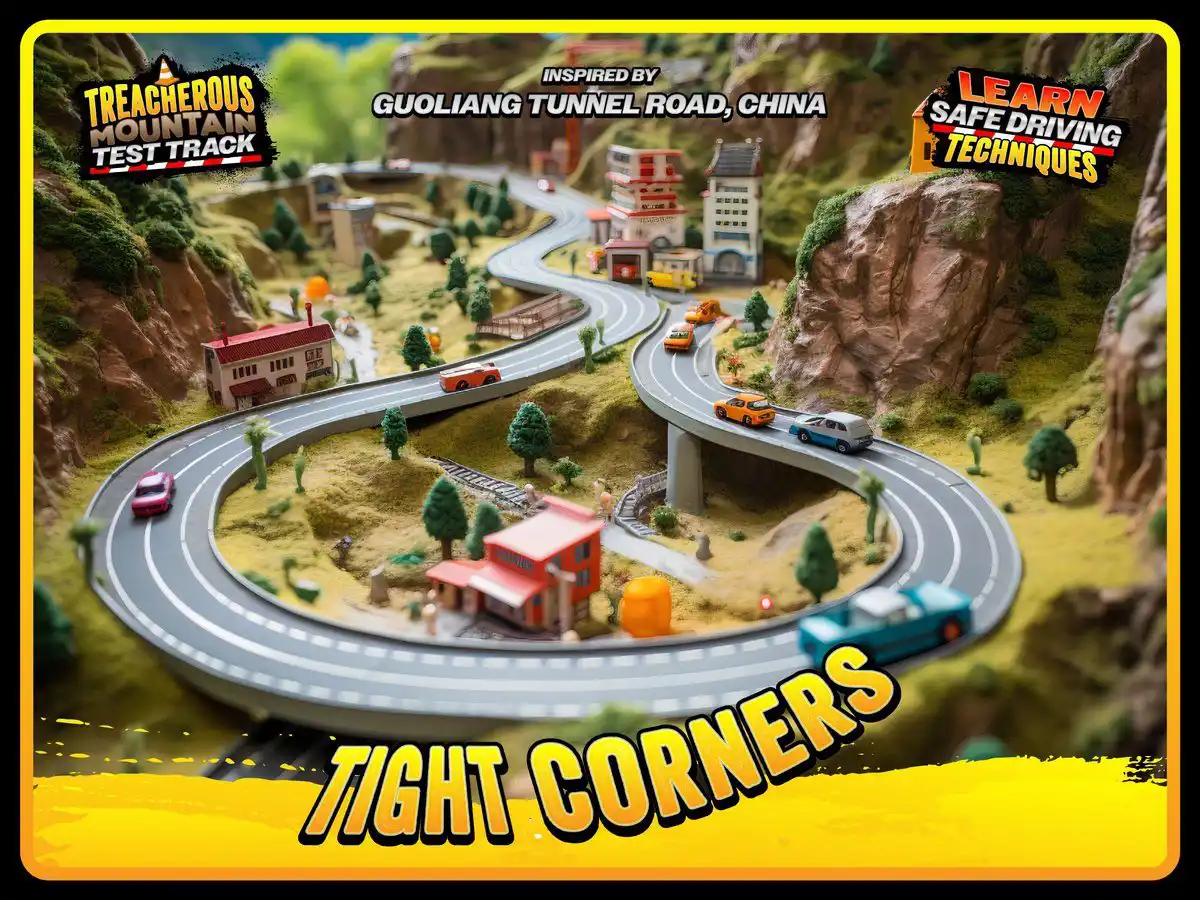
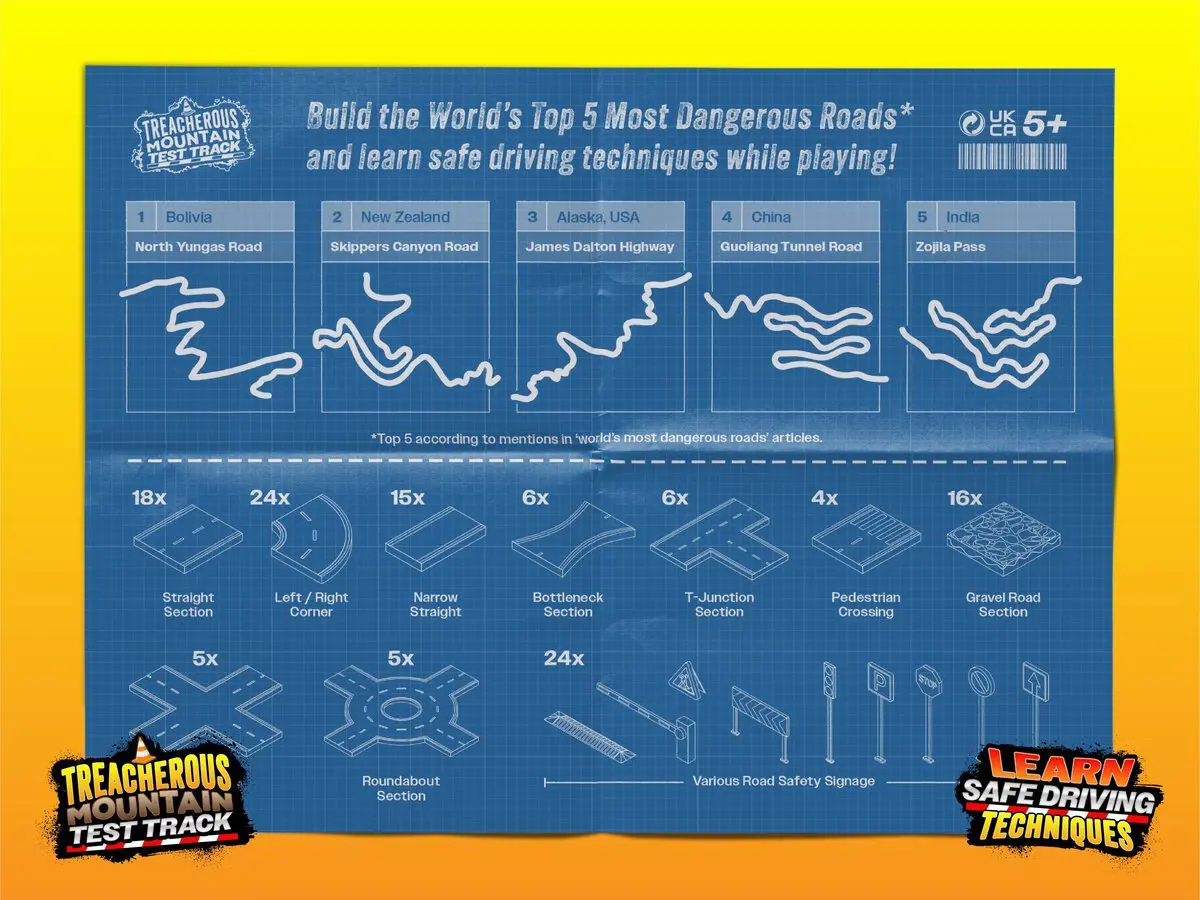
The Treacherous Mountain Road Test Track
Leasing Options has uncovered the most dangerous roads in the world and incorporated the most treacherous and tricky elements of these roads into a new track to help teach children how to be safe while on the road.
Track Features;
- Design and layout based on the world’s top 10 most dangerous roads.
- Road safety elements are incorporated into the route to promote safe driving practices. The route includes;
- Speed limits
- Give way signs
- Road hazard signs
Chief Operating Officer at Leasing Options, Mike Thompson, highlights the reason behind the creation of the new safe driving toy for children.
“It’s vital that we make an effort to teach kids about the need to drive safely. While toys created for them are fun and exciting, they can also promote unsafe driving, which could be a reason why we’re seeing so many young adults involved in accidents these days.
One of the key factors we want to help spread awareness of is speeding. Recent data reveals that every 1% increase in mean speed produces a 4% increase in a fatal crash and a 3% increase in a serious crash. This shows the huge impact speeding can have, even if you think that going just a little over the limit won’t hurt.
We’re hoping this new track will give kids some food for thought while having fun at the same time.”
40% of the top 100 best-selling kids' car toys are associated with dangerous driving
You might have played with HotWheels when you were a kid, but have you ever stopped to think about the names behind these iconic toys? In fact, some of them could actually promote speeding and dangerous driving without us even realising. To do this, we ran the names of the top 100 best-selling kids' car toys through a sentiment analytics tool to find out if they had a positive or negative sentiment.
We can reveal that 40% of the car toys have a negative sentiment value overall, with only 12 out of the 100 toys coming back as positive.
Top 10 toys with the most negative sentiment scores
|
TOYS |
SENTIMENT |
|
Marvel Knight Rider 1982 Pontiac Trans AM |
-0.74 |
|
LEGO Technic 42111 Fast & Furious Dom's Dodge Charger Car Model |
-0.65 |
|
Marvel Mile Morales 2017 Ford GT 1:24 Scale Vehicle with Figure |
-0.65 |
|
Hot Wheels Premium Car Boulevard 1:64 Die-Cast Assortment |
-0.64 |
|
Hot Wheels City T-Rex Chomp Down Playset |
-0.64 |
|
Hot Wheels Monster Trucks Car Chompin' Mega Wrex |
-0.64 |
|
Bruder SCANIA R-Series Garbage Truck Toy |
-0.64 |
|
Jurassic World Dominion: Mega Stomp & Rumble Giga Dinosaur |
-0.64 |
|
Remote Control Air Hogs Zero Gravity Laser Racer Blue Car |
-0.64 |
|
Marvel Ironman 2016 Chevy Camaro SS 1:24 Scale Vehicle with Figure |
-0.63 |
Top 10 Most Dangerous Roads Revealed
To teach children how to drive safely, we have uncovered the world's most dangerous roads to incorporate these elements into our tracks. To find the top 10 most dangerous roads, we used an SEO analytics tool to find the top 10 performing articles based on the topic. We then compiled a list of all the roads featured in these articles, which totalled 120, and then ranked them by the number of times they appeared. Here are the roads that were mentioned the most.
|
Rank |
Road |
Country |
|
1 |
Yungas Road - "Road of Death" |
Bolivia |
|
2 |
Skippers Canyon Road |
New Zealand |
|
3 |
James Dalton Highway |
USA (Alaska) |
|
4 |
Guoliang Tunnel Road |
China |
|
5 |
Zojila Pass |
India |
|
6 |
Fairy Meadows Way |
Pakistan |
|
7 |
Karakoram Highway |
China/Pakistan |
|
8 |
Rodovia da Morte - "The Highway of Death" |
Brazil |
|
9 |
Stelvio Pass Road |
Italy |
|
10 |
Atlantic Road |
Norway |
At the top of the list is the Yungas Road, which locals call the “Road of Death”. According to reports, the road at one time would cause 200-300 motorists to veer off the road, and down the cliff face every year, resulting in around one death per day.
Next up is Skippers Canyon Road found in New Zealand, which takes around 100 lives per year. This road is narrow and it’s very difficult to manoeuvre your car due to the road being too narrow for vehicles to pass each other. It’s also unpaved, winding and full of dangerous drop-offs, not to mention the fact that there are no safety barriers!
And, rounding off the top three is the James Dalton Highway in the USA. This road has a number of very steep gradients and is heavily used by large tractor-trailers that kick up thick clouds of dust, mud and gravel, which significantly reduces visibility. These big trucks have the right of way, so other drivers must give way. It’s also a good idea to always drive with your headlights on so others can see you. Drivers also have to navigate enormous potholes and the extreme Arctic weather.
Top 10 hazardous countries to drive in
After analysing the most dangerous roads, we took it one step further and can reveal the most hazardous countries to drive in. According to WHO data, China is the most hazardous country to drive in when looking at the total number of fatalities since 2000, with a staggering 5,465,327 casualties. That calculates to 788 a day!
|
Rank |
Country |
Total Estimated Road Deaths Since 2000 |
|
1 |
China |
5,465,327 |
|
2 |
India |
3,982,686 |
|
3 |
Brazil |
831,067 |
|
4 |
USA |
829,912 |
|
5 |
Nigeria |
767,480 |
|
6 |
Russia |
654,494 |
|
7 |
Indonesia |
640,459 |
|
8 |
Pakistan |
495,396 |
|
9 |
Thailand |
490,544 |
|
10 |
Bangladesh |
459,967 |
In comparison, the UK has seen an estimated 58,874 road traffic fatalities since 2000, which is nearly 100 times less than China and 14 times less than the amount reported in the USA.
|
Rank |
Country |
Total Estimated Road Deaths Since 2000 (per 100,000 population) |
|
1 |
Thailand |
736 |
|
2 |
Zimbabwe |
732 |
|
3 |
Democratic Republic of the Congo |
712 |
|
4 |
Liberia |
707 |
|
5 |
Dominican Republic |
690 |
|
6 |
Eritrea |
689 |
|
7 |
Rwanda |
675 |
|
8 |
Venezuela |
663 |
|
9 |
Central African Republic |
661 |
|
10 |
Burundi |
654 |
If you break down the figures to look at it per 100,000 of the population, interestingly, China goes from first to 72nd, with only 399 per 100,000 people, which is only 21 per year on average.
Instead, it’s Thailand that comes out on top, with 736 road traffic deaths per 100,000 people, at an average of 39 deaths per year. Thailand is just ahead of Zimbabwe and the Democratic Republic of the Congo, which have seen 732 and 712 deaths respectively since the year 2000.
Furthermore, the USA moves from the fourth worst country all the way down to 122nd with an estimated 272 road traffic deaths per 100,000 people since 2000. That sees their death rate drop to only 14 per 100,000 people.
Top 10 safest countries to drive in
Perhaps unsurprisingly, when you look at the other end of the spectrum at the safest place to drive in, we find a collection of some of the smaller countries and areas in the world.
|
Rank |
Country |
Total Estimated Road Deaths Since 2000 |
|
1 |
Antigua and Barbuda |
69 |
|
2 |
Micronesia |
89 |
|
3 |
Kiribati |
130 |
|
4 |
Saint Vincent and the Grenadines |
149 |
|
5 |
Grenada |
155 |
|
6 |
Maldives |
163 |
|
7 |
Seychelles |
226 |
|
8 |
Tonga |
276 |
|
9 |
Malta |
343 |
|
10 |
Iceland |
379 |
Antigua and Barbuda, the sovereign island country in the West Indies, has only had an estimated 69 road traffic deaths since 2000, which averages out to only 4 per year. After them comes the country of Micronesia, which consists of about 2,000 small islands in the Northwestern Pacific Ocean.
Aside from small islands, it is interesting to find Iceland in the top 10 safest countries to drive in, which, despite roads being constantly icy and covered in snow, has only had an estimated 379 deaths since 2000.
|
Rank |
Country |
Total Estimated Road Deaths Since 2000 (per 100,000 population) |
|
1 |
Maldives |
43 |
|
2 |
Antigua and Barbuda |
82 |
|
3 |
Malta |
83 |
|
4 |
Micronesia |
84 |
|
5 |
Sweden |
88 |
|
6 |
Norway |
90 |
|
7 |
Singapore |
91 |
|
8 |
UK |
95 |
|
9 |
Netherlands |
97 |
|
10 |
Switzerland |
97 |
Despite dropping out of the top 10 safest per 100,000 of the population, Iceland still ranks very highly, ranking 15th with only 124 road traffic deaths since 2000. In fact, all Norden countries rank extremely highly in general.
Iceland is actually the worst of the bunch, with Finland just above in 14th with 123 deaths since 2000, Denmark in 12th with 113, Norway in 6th with 90 and Sweden ranking as the safest of the safe Norden countries in 5th with only 88 deaths per 100,000 people since 2000, working out at an average of just five per year.
You can also see that the UK ranks very well, coming in eighth with just 95 road traffic deaths per 100,000 since 2000, which works out at five per year. In comparison, the USA ranks pretty poorly, positioned in 62nd with 272 road traffic deaths per 100,000 people (14 per year).
Car Leasing with Leasing Options
If you are looking for a brand-new car, there’s no better way to get behind the wheel than with car leasing. Here at Leasing Options, we have a huge range of car lease deals to suit all needs and, if you need any help, our team is always on hand if you require any assistance along the way.
Methodology
All road traffic accident data was sourced from the World Health Organisation (WHO). Using this data, we calculated how many total deaths had occurred since 2000, as well as how that translated per year, month, week and day.
For the car toys, we used the sentiment tool text2data, where we input the top 100 best-selling car toy names, sourced from ToysRUs and Smyths.
The most dangerous roads were calculated by compiling all the roads featured in the top 15 performing articles on the same topic, which we sourced using Ahrefs. We then ranked the roads by the number of times they appeared in total across those articles


